Application Health-check
Build Lightweight Health Monitor Pages
Modern applications rely on many moving parts-authentication, APIs, frontend services, DNS, and more. Your stack is only as reliable as its weakest link. When something fails, users don’t always see an error; often, it’s just a spinning loader or a failed login. That’s why real-time session load balancing and proactive monitoring are critical for seamless user experiences.
In this post you learn how to use NetScaler to create a simple, powerful Health Monitor page to create a lightweight internal tool that gives instant insight into your app’s live status and helps steer traffic to healthy backend components.
The Problem: Distributed dependencies, fragmented visibility
Most environments monitor each stack component separately:
GSLB checks for geographic failover
Route53 or Azure Traffic Manager checks for availability
Simple HTTP checks often miss deeper backend dependencies
But when asked, “Is the app OK right now?”-there’s rarely a clear answer. More dashboards and scripts add complexity, not clarity.
The Solution: NetScaler health monitor page
With NetScaler responder policies, you can:
Aggregate the health of your most critical virtual servers
Return a lightweight HTML health page
Use this page for:
External health checks (GSLB, cloud traffic managers)
Internal visibility for DevOps and support teams
Triggering maintenance or alerting workflows
How it works
NetScaler’s built-in monitors already track service health. You can use expressions like:
Expression example
This returns TRUE or FALSE, letting you combine multiple checks into a single responder action that outputs a simple HTML page.
Example Configuration:
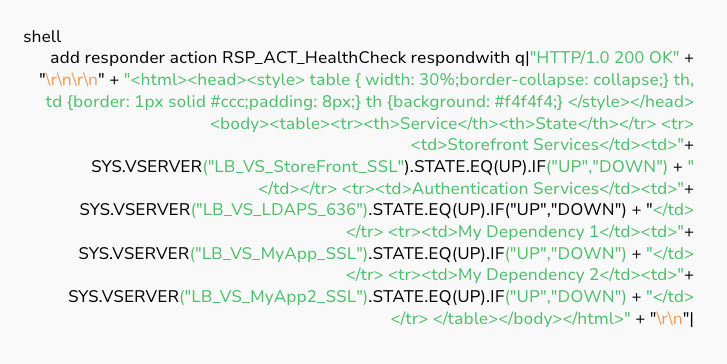
Configuration example
Bind this to a virtual server or expose it at /healthcheck. This works for web apps and Citrix Gateways-just remember to monitor backend dependencies, not just the gateway itself.
When and where to use it
GSLB, Azure Traffic Manager, AWS Route 53, Akamai Cloud DNS: Provides a quick pass/fail signal for routing
Internal Support or SRE: Real-time service state at a glance
Maintenance Windows: Instantly verify if dependencies are restored after updates
Advantages
Zero new tooling: Built entirely with NetScaler
Customizable: Add services or logic as needed
Readable: For both machines (HTTP) and humans (HTML table)
Lightweight: Minimal processing, instant output
Final Thoughts
Users expect your app to just work-regardless of which component fails. A NetScaler-powered Health Monitor page acts as a smart gatekeeper, ensuring only healthy components are presented and traffic is routed optimally. By consolidating service status in real time, you reduce downtime, avoid partial outages, and build real user trust.
A simple check makes a major difference, right where it matters most: the user experience. Contact us for instant expert advice (not a Sales Rep).