How to Troubleshoot High Memory Usage on NetScaler with Real‑World memstats Analysis
Step 1: Confirm high memory usage
When an alert reports high memory usage on your NetScaler / Citrix ADC (for example above 70%), start by validating the live status on the appliance.support.
Run in the CLI:

NetScaler CLI command stat system memory
This command shows overall system memory statistics, including allocated, in‑use, free, and integrated cache memory.
Key fields to understand
From the Citrix ADC Memory Information section:
Maximum Memory Available (MB) – Total system memory available for the packet engine (PE).
Memory Currently Available (MB) – Total memory available (grabbed) for use by PE.
Memory Allocated (MB / %) – Currently allocated memory in megabytes and percentage.
InUse Memory (MB / %) – Total Citrix ADC memory actually in use and its percentage.
Free Memory (MB) – Total free PE memory in the system.
Maximum Allocation Failed (MB) – Total memory allocation failures; anything above 0 is a red flag.
From the Citrix ADC Shared Memory Information section:
Total Shared Memory (MB) – Maximum shared memory allowed.
Shared Memory InUse (MB / %) – Current shared memory usage in MB and percent.
Maximum Allocation Failed (MB) – Shared memory allocation failures.
From the Citrix ADC Integrated Cache Memory Information section:
Maximum Memory (MB) – Total memory assigned to Integrated Cache.
InUse Memory (MB / %) – Current Integrated Cache usage.
If total utilization is high but allocation failures remain at 0, the appliance is heavily used but not yet failing allocations.
Step 2: Determine when the issue started
Before deep‑dive analysis, clarify the context of the spike.
Ask:
Did memory usage increase after a firmware upgrade? Check release notes and known issues.
Did it follow a configuration change (for example enabling SSL VPN, AAA, AppFirewall, DNS or debug features)?
Did it start suddenly without obvious changes, which might point to a traffic pattern change or a potential bug.
For VPX appliances, also verify that the hypervisor provides enough RAM:
Typical minimum: 4 GB.
Recommended: 8 GB or more depending on throughput, features and number of sessions.
To see memory assigned to the underlying FreeBSD system:

Checking available memory
Step 3: Compare historical memory statistics (newnslog / memstats)
The most effective way to find the root cause is to compare memory statistics from:
A normal day (no issue).
A problem day (high memory usage).
1.Go to the nslog directory:

NetScaler shell navigation to /var/nslog directory to access newnslog files
2. Identify the correct newnslog file for each date, for example:

Archived NetScaler newnslog file used for historical memstats memory analysis
3. Extract memory statistics using nsconmsg:
For a specific archived log:
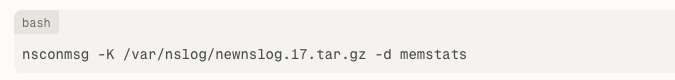
memstats analysis on archived newnslog file
For the current log:
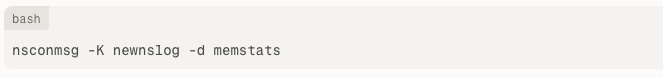
memstats command analyzing memory statistics from newnslog file
Focus on:
AllocatedandActual In Usepercentages.Free memory in MB.
Feature‑specific memory pools (for example
MEM_SSLVPN,MEM_AAA,MEM_DNS,MEM_TBUF,AAASESSION).
Step 4: Real‑world example: SSL VPN / AAA sessions
In our real environment we compared memstats for a normal day and a problem day at the same time (09:08).
Normal day
Allocated: 71.91%
Actual In Use: 46.12%
Free: roughly 1.9 GB
Key memory pools:
MEM_SSLVPN→ 212 MB (3.11%)MEM_AAA→ 163 MB (2.40%)AAASESSION→ 21,024 sessions allocated
Problem day
Allocated: 92.12%
Actual In Use: 76.37%
Free: roughly 537 MB
Key memory pools:
MEM_SSLVPN→ 1.72 GB (25.27%)MEM_AAA→ 541 MB (7.93%)AAASESSION→ 72,864 sessions allocated
The comparison shows a clear, correlated increase in:
MEM_SSLVPNMEM_AAAAAASESSIONpool allocations
This indicates that the higher memory usage is driven by a surge in SSL VPN and AAA sessions rather than a generic memory leak.
Step 5: Inspect live AAA / VPN sessions
To confirm, list all active AAA sessions:
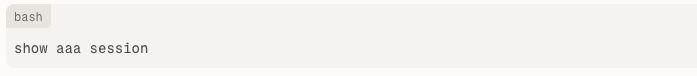
command show aaa session used to verify active authentication sessions
In our case, this command showed that a single user had an unusually high number of active sessions, which caused excessive memory allocation in the SSL VPN and AAA pools. This behaviour is consistent with features that allocate per‑session memory structures (for example session tables, policies, tunnel state) that scale linearly with concurrent sessions.
Root cause in this example
Excessive SSL VPN / AAA sessions on the appliance.
One user generating a very large number of concurrent sessions.
Resulting in elevated usage of
MEM_SSLVPN,MEM_AAAandAAASESSIONpools and overall high memory utilization.
Remediation typically includes cleaning up stale sessions, adjusting session timeouts, investigating client behaviour (for example reconnect loops), and hardening access policies.
Step 6: Practical checklist for future incidents
When troubleshooting high memory usage on NetScaler / Citrix ADC:
Verify current memory status with
stat system memoryand note allocated, in‑use and free memory, including any allocation failures.Establish when the issue started and correlate with upgrades, configuration changes, or traffic events.
Use
nsconmsg -K newnslog -d memstatson a healthy day and a problematic day, then compare:Overall
AllocatedandActual In Usepercentages.Which memory pools increased significantly.
For every mempool with major growth, understand what it represents (system, feature, logging, buffering, sessions) using Citrix system counter documentation and support articles.
Focus investigation on the matching feature: for example SSL VPN / AAA, DNS, Integrated Cache, AppFirewall, or DEBUG / tracing features.
Remember that most high memory situations are caused by increased demand from specific features or traffic, not by a true memory leak; leaks are usually accompanied by persistent growth and potential allocation failures.
A structured, side‑by‑side comparison between a healthy day and a problem day, combined with live session analysis, is still the most reliable way to pinpoint the root cause of NetScaler memory issues and fix them before they impact users. Would you like to know more? Follow us on LinkedIn for more updates or contact us directly with your questions.