Troubleshooting Citrix NetScaler Traffic Flow with nsconmsg -d current -g hits
When users cannot log in or access applications through Citrix NetScaler / Citrix ADC, you need to see where their traffic is going inside the appliance.
One of the most effective tools for this is the nsconmsg command with hit counters.
The command nsconmsg -d current -g hits lets you inspect real‑time counters for many NetScaler components, so you can see which policies, services or features a specific request is touching during authentication or application access.
Understanding where traffic is processed in the NetScaler pipeline is key for troubleshooting authentication issues, policy evaluation problems, routing mistakes or load‑balancing misconfigurations.
Why use nsconmsg for troubleshooting?
When a user connects through NetScaler, the request typically passes through several internal modules:
Routing and VLAN interfaces.
Access Control Lists (ACLs).
Content Switching (CS) policies and vServers.
Load‑balancing virtual servers and services.
Authentication modules and NetScaler Gateway.
Rewrite and Responder policies.
VPN session processing and other features.
The command:
nsconmsg –d current –g hits
shows hit counters for all of these processing points.
Each counter increases when traffic matches a specific module or policy, which helps you quickly identify:
Where traffic is being processed.
Whether policies are actually triggered.
If traffic is reaching the expected virtual server.
Where traffic flow stops or fails.
This is extremely useful for debugging login failures, policy mismatches, wrong redirects or application access problems on Citrix NetScaler.
Viewing all NetScaler hit counters
To see the full list of hit counters currently active on the appliance, run:
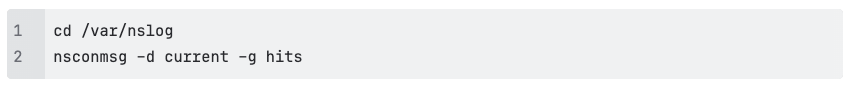
This gives you a live view of traffic flow across all major NetScaler features.
This gives you a live view of traffic flow across all major NetScaler features.
Typical components you will see include:
Route lookups.
VLAN processing.
ACL matches.
Content Switching decisions.
Load‑balancing vServers and services.
Authentication and Gateway processing.
Rewrite and Responder policy engines.
By monitoring these counters while reproducing the issue, administrators can track exactly which internal modules are being triggered by a user's request.
Filtering for specific features
The full -g hits output can be large, so it is common to filter for the feature you are investigating.
Checking Rewrite policies
Rewrite policies modify HTTP requests or responses.
To see whether rewrite policies are being hit:

This helps you confirm if a request is being changed by a rewrite rule that might impact application behaviour.
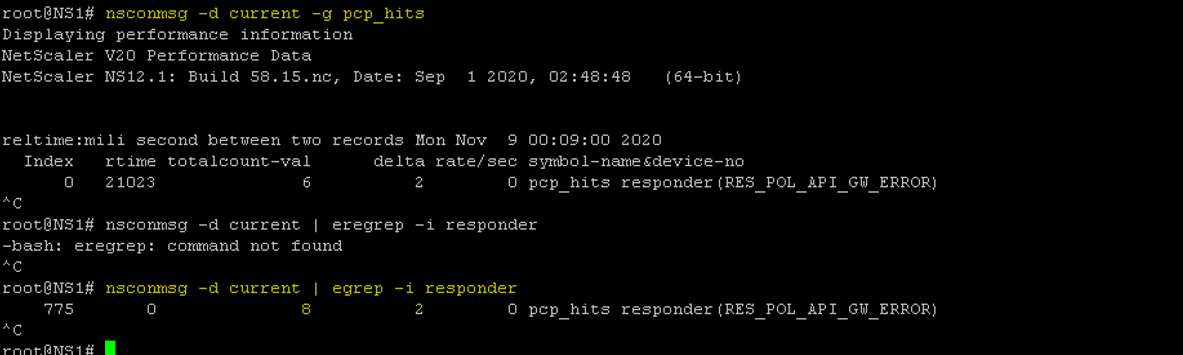
Check Responder policies
Responder policies handle redirects, blocking and custom responses.
To focus on Responder hits:

Use this when troubleshooting unexpected redirects, blocks or security responses.
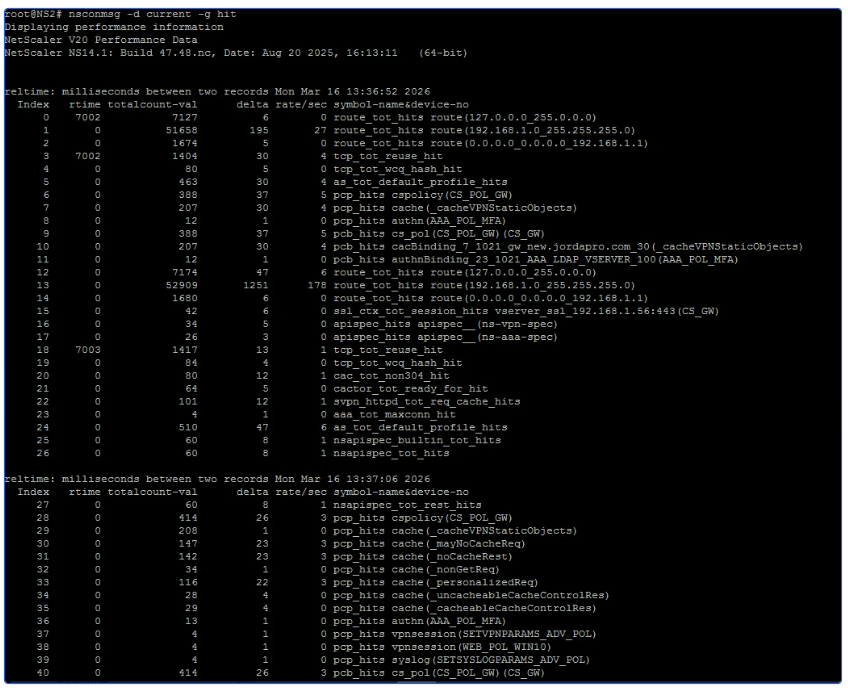
Check policies hits
To see policy‑related hit counters more generically, use:

This is helpful for:
Unexpected access denials.
Policies that never seem to trigger.
Security rules that fire more than expected.
Check VPN session activity
In NetScaler Gateway / VPN environments, you can track whether VPN sessions are created correctly:

These counters can indicate if:
VPN sessions are being created
Session establishment is failing
Traffic is reaching the Gateway authentication module
Example troubleshooting workflow
A typical troubleshooting scenario might look like this:
Start capturing hit counters:
nsconmsg –d current –g hits
Ask the user to log in or access the affected application.
Observe which counters increase and note the modules involved.
Narrow the investigation with targeted filters, such as:
nsconmsg –d current | egrep –i rewrite
nsconmsg –d current | egrep –i responder
nsconmsg –d current | egrep –i vpnsession
Identify the point where traffic stops progressing in the NetScaler pipeline—for example, policies are hit but the expected vServer counters remain at 0.
Review the configuration for that module (policy bindings, expressions, vServer settings) and correct the issue.
Key benefits of using hit counters
Using nsconmsg in this way gives NetScaler administrators several advantages:
Real‑time troubleshooting without heavy packet captures.
Clear visibility into internal traffic flow and decision points.
Faster root‑cause analysis for authentication problems, wrong routing and policy issues.
Minimal impact on production systems compared with full debug logging.
Unlike packet captures, this method focuses on NetScaler’s internal processing logic, which makes it especially effective for diagnosing configuration and policy issues in complex environments.
Conclusion
The nsconmsg -d current -g hits command is a powerful troubleshooting tool for Citrix NetScaler / Citrix ADC administrators. By monitoring hit counters and filtering on specific features such as rewrite, responder or VPN sessions, you can quickly see how user traffic is processed and where it stops in the NetScaler architecture.
This approach significantly simplifies troubleshooting for authentication issues, application access failures and policy misconfigurations, and helps keep your Citrix environment stable and performant.
Do you need quick advice, book a meeting directly with one of our experts.